Disclaimer: The information is not intended and shall not be understood or construed as legal, tax, investment, financial, or other advice. DYOR!
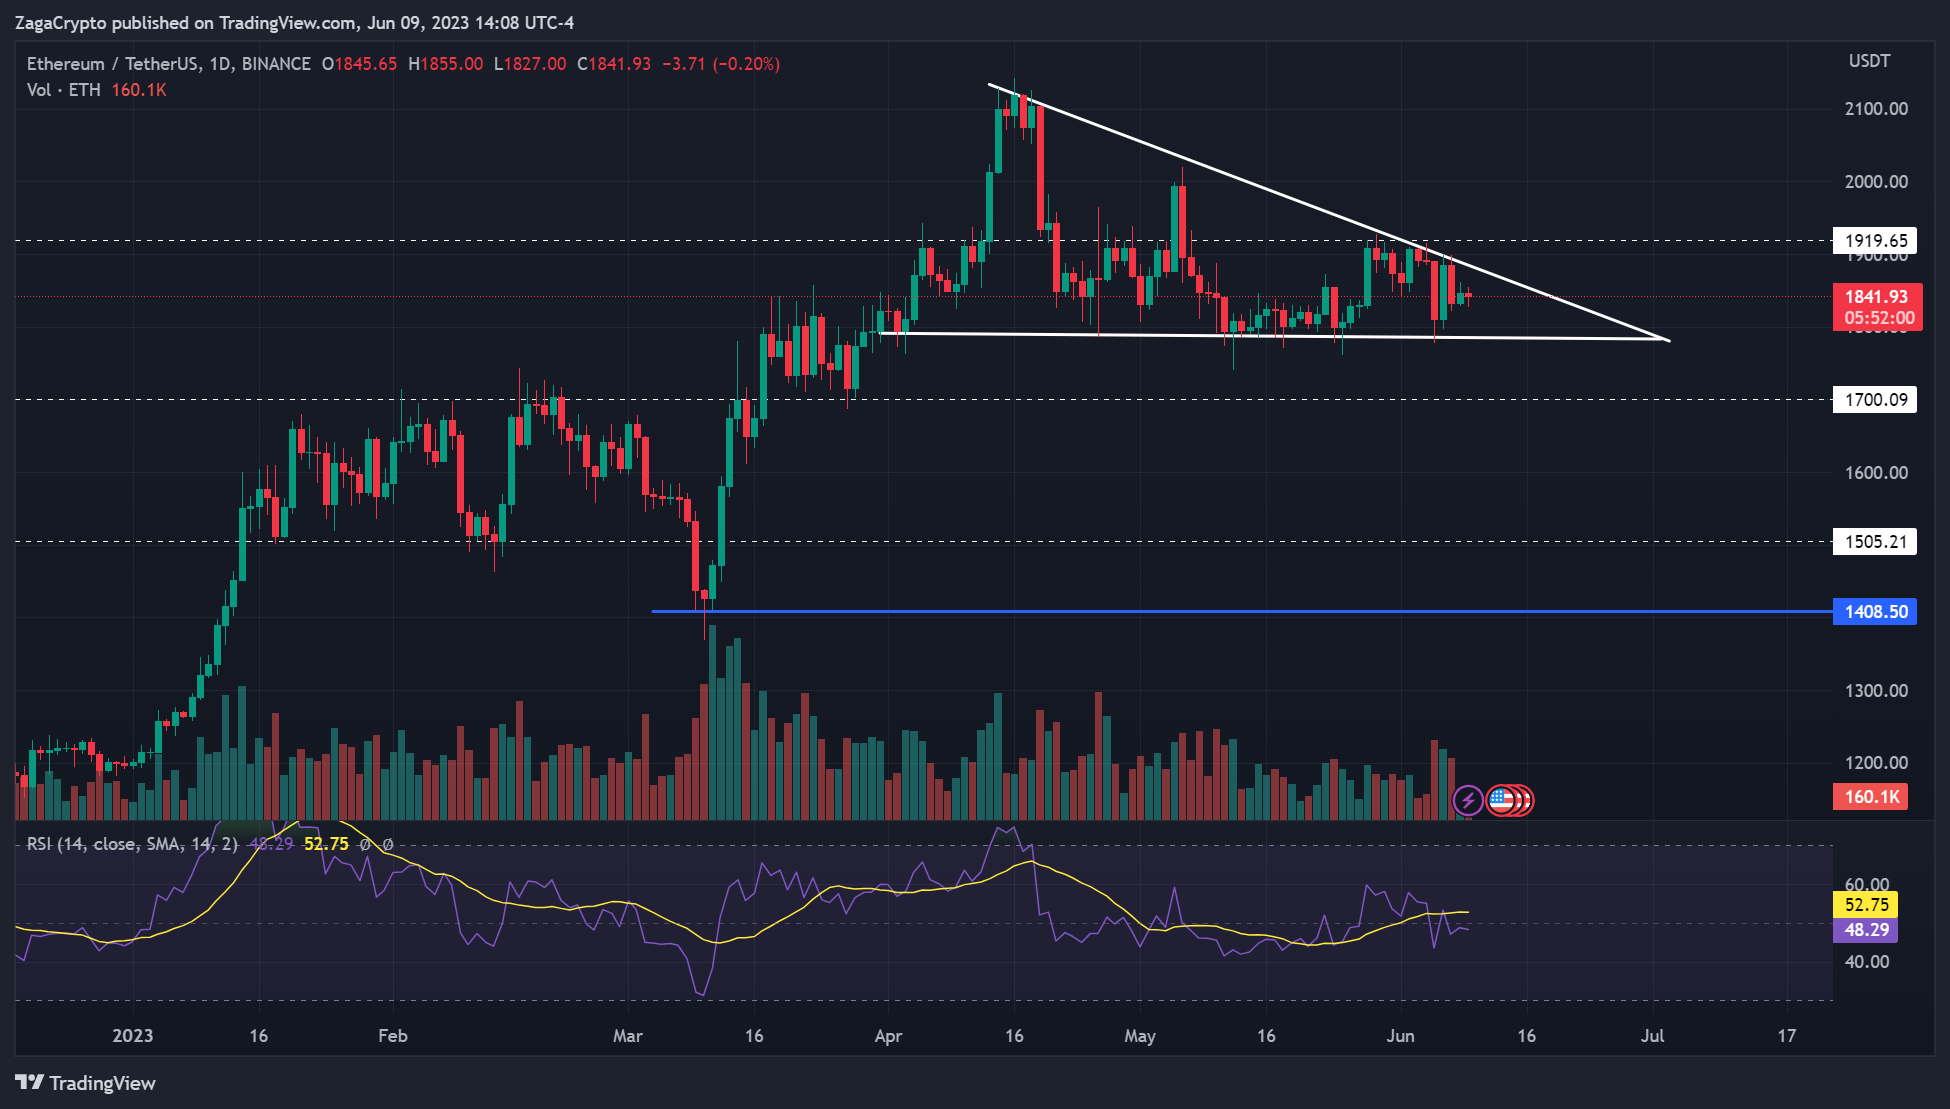
- ETH formed a bearish descending triangle pattern
- Sellers should be aware of the possibility of a liquidity grab near $1,700
Ethereum’s [ETH] recent price action is alarming and suggests a likely further value depreciation.
The king of altcoin has been making lower highs alongside similar lows since mid-April, forming a descending triangle pattern. The pattern is a typical bearish formation and could affect ETH HODLers.
The ETH price was $1842 at press time, down 2.7% in the past seven days, as per CoinMarketCap. Next week’s FOMC meeting (13/14 June) could inject extra volatility and induce a breakout.
ETH squeezes in a corner – Is a breakout likely?
ETH’s price action tightened and squeezed into the descending triangle’s corner – pointing to a likely breakout soon. A downside breakout is more likely, given the bearish chart pattern formation.
ETH’s likely drop could ease on the lower support levels – $1,700 or $1,500. Nevertheless, traders should be careful of a liquidity grab below $1,800. ETH has defended the $1,800 level despite Bitcoin’s [BTC] sharp drop to $25k following the Binance lawsuit.
Conversely, ETH could attempt to rally if $1,800 is secured again. However, bulls must crack the trendline resistance to gain an edge and target the $1900 price zone. A retest of $2000 and $2100 psychological levels could be likely if ETH close above $1900.
The RSI (Relative Strength Index) has seen rejection at 60 and 50 marks, indicating declining buying pressure in the past few days.


![Here’s why $26,200 is a crucial price level for Bitcoin [BTC]](https://zagacrypto.com/wp-content/uploads/2023/05/image-1200x900-1-440x264.png)


